Hormuz War-Risk Insurance Premiums Surge 1,900% as Oil Lags
War-risk insurance premiums for Strait of Hormuz tanker transits have surged roughly 1,900%, from ~0.25% to ~5% of hull value. A $100M tanker now faces a ~$5M insurance bill for a single crossing. Crude oil is up 4%. The gap between those two numbers is the story.
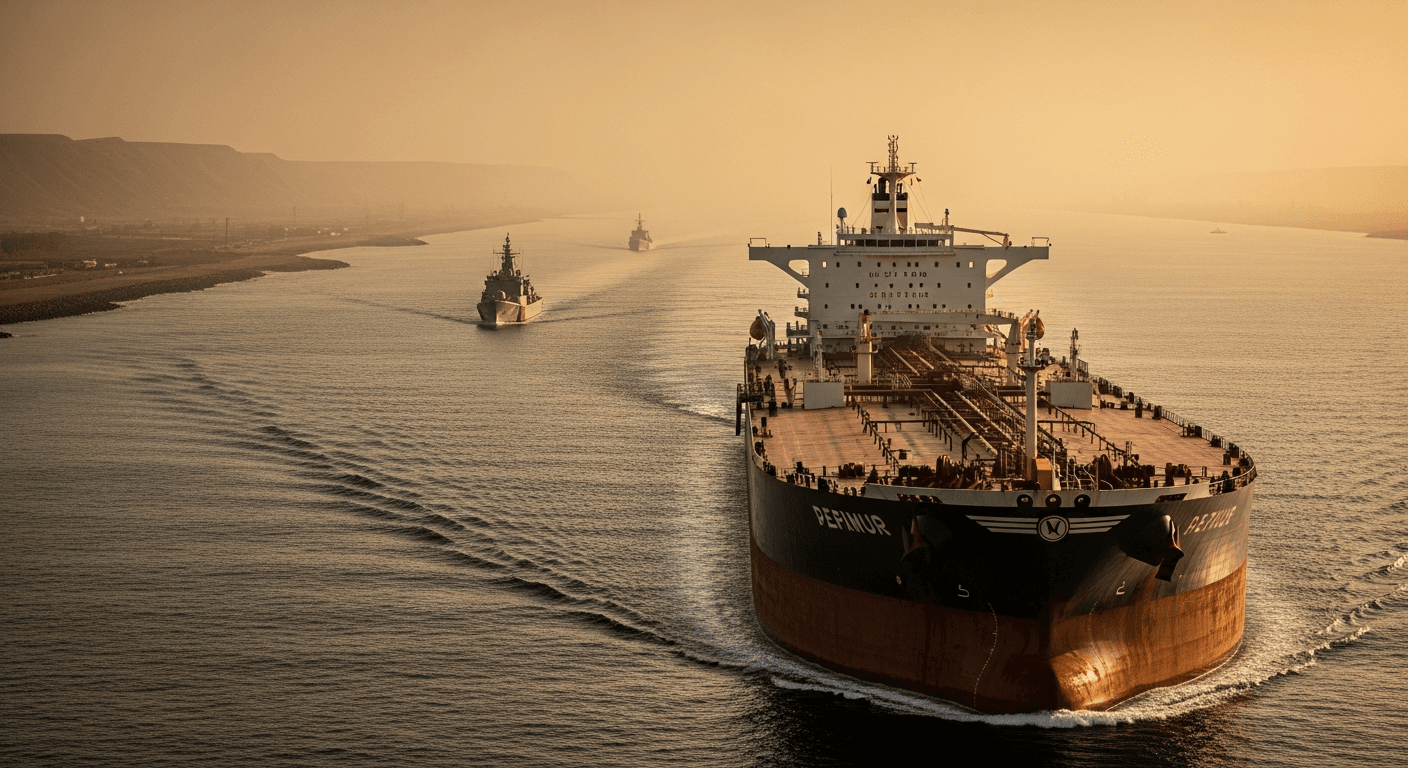
The people holding the liability are pricing this differently than the people holding crude futures.
Key takeaways
- War-risk insurance premiums for Strait of Hormuz tanker transits have surged roughly 1,900%, from ~0.25% to ~5% of hull value; a $100M tanker now carries a ~$5M insurance bill for a single crossing.
- Oil's ~4% spot gain on July 22 massively understates the disruption risk: underwriters with direct liability exposure are pricing a conflict-zone reality while crude markets are still trading diplomatic hope.
- If elevated insurance costs persist, the transmission runs directly through freight, fuel, CPI, and monetary policy, the same debt-debasement loop that makes hard money relevant.
War-risk insurance premiums for tankers crossing the Strait of Hormuz have surged roughly 1,900%, according to a deVere Group analysis citing Lloyd's Market Association figures, first reported by Bitcoin.com News on July 22. The cost of covering a large crude carrier has climbed from approximately 0.25% of hull value before the conflict began to roughly 5% today, meaning a single transit for a $100M tanker now carries an insurance bill of about $5M, up from roughly $250K.
That move dwarfs what crude oil did on the same day.
The Spread Between Insurance and Spot Is the Signal
Oil prices moved on July 22 as U.S. military operations continued in the region, with Brent crude gaining roughly 4%. WTI rose approximately 3.1% on the day, per TradingEconomics.
Neil Roberts, Head of Marine and Aviation at Lloyd's Market Association, confirmed the 5% rate as of July 10: "War-risk rates have moved as risk has moved." The deVere Group has separately flagged that markets are underpricing Hormuz risk relative to the physical reality on the water.
The divergence is the point. Oil traders are pricing sentiment about future supply and diplomatic outcomes. Underwriters are pricing the immediate cost of putting a vessel in the strait. Those are two very different bets, and the people with actual liability exposure are not sanguine.
The war premium between insurance markets and spot has been building since the conflict began February 28, 2026 with coordinated U.S.-Israeli airstrikes. Rates had briefly spiked to 10% of hull value earlier in the conflict before retreating to the current ~5% level, per Lloyd's Market Association data via GlobalSecurity.org. A U.S.-Iran memorandum of understanding signed June 17 opened a 60-day negotiation window; Iran subsequently resumed attacks, and premiums climbed again.
The Chokepoint Math Nobody Wants to Run
The EIA's World Oil Transit Chokepoints analysis puts Hormuz throughput at approximately 20.9 million barrels per day in the first half of 2025, roughly 20% of global petroleum consumption and about 25% of all seaborne oil trade. By Q1 2026, actual flows had already fallen to approximately 14.6 mb/d, a roughly 30% year-over-year decline, per EIA global energy security data.
Pipeline bypass capacity from Saudi Arabia and the UAE covers only a fraction of that volume. The Fujairah bypass route has expanded, but it cannot absorb a full closure.
Per the IEA's Hormuz page, roughly 80% of the oil moving through the strait is destined for Asia, China, India, Japan, and South Korea bearing the most exposure. China has built strategic reserves. Japan and South Korea have limited alternatives and limited buffer.
Higher war-risk premiums do not stay contained to underwriters' balance sheets. They flow directly into freight costs, then into refinery input costs, then into fuel prices, then into the price of moving everything else. That is the transmission chain from a chokepoint to a CPI print. The inflation-oil feedback loop is not hypothetical, it is the mechanism.
The falsifiable thesis: war-risk premiums are a more honest leading indicator than crude spot right now. If a durable U.S.-Iran agreement restores Hormuz transit within the current 60-day MoU window, premiums snap back toward pre-conflict levels and the inflationary transmission chain breaks. That is the specific outcome that disproves the thesis.
What to Watch
The 60-day U.S.-Iran negotiation window is the near-term clock. If it expires without a durable agreement, insurance costs are likely to remain elevated or climb further as operators reassess transit risk.
Watch whether tanker operators begin voluntarily avoiding the strait in volume, reduced traffic compounds the supply tightening without requiring a formal closure. The Iran-Kuwait strikes earlier in the conflict showed how quickly adjacent infrastructure becomes a target when the strait itself is contested. Any expansion of that targeting pattern would push premiums higher again and start moving the spot price to close the gap with what underwriters are already pricing.
Update, August 26, 2026
Iran and Oman outlined a proposal Tuesday to jointly establish a temporary shipping channel through the Strait of Hormuz, with Tehran and Muscat discussing a "phased framework" for a temporary shipping corridor and agreeing to clear mines from the waterway. The two sides will hold further talks to negotiate a permanent route within 30 to 60 days, per the semi-official Tasnim news agency citing Iranian Deputy Foreign Minister Kazem Gharibabadi. The deal mechanics got more specific on Wednesday. IRGC spokesman Hossein Mohebbi confirmed that "agreements have been reached regarding each country's share of the strait's waters as well as Iran and Oman's share of its revenues," according to the state-run Sepah News agency.
Iranian state television indicated the new transit corridor would enter through Iranian territorial waters, with part of the exit route also passing through them, spanning roughly seven miles.
The revenue-sharing structure is the sticking point the U.S. cannot accept. Iran has openly pursued a "tolling system" that would charge nations for safe passage, a move Washington has branded unacceptable.
The IRGC accused the United States of obstructing the Iran-Oman negotiations and was explicit: "If the United States stops obstructing and returns to the agreement, we can open the Strait of Hormuz within the framework of the agreement reached... If the United States does not accept our conditions, the Strait of Hormuz will not be opened under any circumstances."
Iran has said a new shipping arrangement with Oman does not constitute a reopening of the waterway, which Tehran claims will reopen only when the war ends on all fronts and the blockade is lifted.
On the U.S. posture, Axios reported that Secretary of State Marco Rubio told allies that Washington will temporarily pause new strikes against Iran, shifting focus toward economic sanctions and naval enforcement in the Strait of Hormuz.
Rubio made clear the U.S. is not planning a return to major combat operations, but did not rule out strikes if Iran attacks first.
A U.S. official said the clearing of mines from the Strait of Hormuz by the U.S. Navy is a watershed moment in the war, largely neutralizing one of Iran's main sources of leverage.
Crude is pricing all of this as resolution. Oil prices fell about 3% to a near one-month low, with Brent dropping below $86 and WTI sliding below $80 a barrel. The strait is not open. The UK Maritime Trade Operations reported that an oil tanker was struck by an unidentified projectile on Tuesday, left disabled approximately nine nautical miles northeast of Oman's Ash Shishah near the entrance of the strait.
Shipping through the Strait of Hormuz continues to decline sharply, with preliminary data showing only one vessel crossing on Monday, compared with six the previous day. The EIA's August 11 Short-Term Energy Outlook had increased estimates of Middle East shut-in production and expected disruptions of roughly 0.6 million barrels per day to persist through end of next year. That thesis is being repriced by the paper market before a single ship has safely transited. War-risk premiums will tell you when the strait is actually open. Spot crude tells you what traders want to believe on any given Wednesday.
Update, September 3, 2026
Netanyahu made the Israeli endgame explicit on Thursday. At a Rosh Hashanah toast with senior defense officials at IDF headquarters in Tel Aviv, the Israeli prime minister said toppling Tehran's government is "the central mission still before us" and declared the goal is "within reach."
The remarks were delivered to senior Israeli military officials as fighting between the United States and Iran has intensified again, with Washington carrying out fresh strikes and Tehran retaliating against U.S.-linked targets in the Gulf. That is not a strategic aspiration being floated by a think tank. That is a sitting prime minister telling his generals the war has one terminal objective.
The Trump White House is running a parallel calculation that directly shapes what happens to Hormuz between now and November. Top aides to President Trump are pushing to keep the Iran war from escalating before November's midterm elections to staunch Republican electoral losses.
Vice President JD Vance and Secretary of State Marco Rubio are among the high-ranking Trump aides who are on board with the idea of trying to keep the Iran conflict relatively "quiet" until November.
White House officials will consider ramping up military action after the November 3 vote, though any return to full-scale conflict is far from a given; for now the administration is focused on tightening economic pressure on Iran in an effort to extract concessions that months of military action failed to secure.
The tension between those two postures is the risk. Reuters reported in August that the military had used "virtually all" of its supply of certain precision missiles, and the Washington Post reported that the heads of the Army, Navy, and Air Force warned Pentagon chief Pete Hegseth in a written assessment that prolonging the war was unsustainable and would diminish military readiness in other theaters. Netanyahu's public declaration of a regime-change endgame and a White House trying to bottle the conflict for electoral reasons are pulling in opposite directions. If Israel moves before November, the administration's quiet period evaporates, the strait stays closed, and every tanker insurance premium discussed in this article reprices upward in real time.
Update, September 7, 2026
Iran is formalizing what has been a de facto blockade into an explicit legal instrument. Mohsen Rezaei, Secretary of Iran's Supreme National Security Council, announced the country will declare a restricted zone extending from "the line where the U.S. naval blockade begins to the Strait of Hormuz region and inside the Persian Gulf," with any ship entering without coordination placed on Tehran's sanctions list, hitting both their insurance coverage and future passage rights. The distinction matters: Iran is no longer just shooting at tankers and mining the channel. It is now asserting a bureaucratic enforcement architecture over the strait, designed to attack a vessel's insurability before it ever reaches the water. Rezaei dismissed Washington's claims that the waterway remains accessible as a "big lie," stating the Strait of Hormuz is "completely closed and under the control of the armed forces."
The announcement came a day after the U.S. struck three Iranian oil tankers near Kharg Island and the Gulf of Oman in response to Tehran launching ballistic missiles at U.S. Navy warships.
The Aramco situation escalated simultaneously. Saudi Aramco's oil facilities in Jazan experienced a fresh attack on Monday, according to sources familiar with the matter. That is sequential targeting of the same Saudi export node, not opportunistic harassment. Iran is working down a list. As of September 6, U.S. forces have redirected 92 commercial vessels, disabled 3, and boarded 2 to enforce the maritime blockade against Iran.
Now the demand side of the equation is closing in on the supply shock. For much of 2026, weak Chinese demand prevented oil prices from surging. That has just changed.
The weakest Chinese imports in years had helped limit price spikes as China removed about 4 million barrels per day of import demand while supply remained constrained at the Strait of Hormuz.
Chinese oil demand has now surged unexpectedly, pushing Shanghai crude prices past the $100 mark. That demand floor being removed was the one factor keeping spot from fully reflecting the war premium. It is no longer in play. Amrita Sen, co-founder and director of research at Energy Aspects, said the pace of inventory drawdowns has accelerated significantly in crude over the last couple of weeks, and she believes crude is poised for a significant upward move.
Oil is approaching $100 a barrel for the third time this year, with Brent crude up about 60% so far in 2026. Refined products like diesel have seen even steeper gains amid the six-month conflict and separate supply disruptions from the Russia-Ukraine war. U.S. Energy Secretary Chris Wright confirmed current Hormuz transits were averaging more than nine million barrels per day, less than half of the roughly 20 million bpd that moved through before the conflict. War-risk underwriters have been sitting at approximately 5% of hull value for weeks. The two variables that were offsetting each other -- constrained supply, suppressed Chinese demand -- are now pointing in the same direction. Spot crude at $97 is still not that.
Sources
Frequently Asked Questions
What happens to global oil supply if the Strait of Hormuz closes completely?
Roughly 20.9 mb/d moved through Hormuz in the first half of 2025, representing about 20% of global petroleum consumption and 25% of seaborne oil trade, per the EIA. Available pipeline alternatives from Saudi Arabia and the UAE can reroute only a fraction of that volume. No combination of bypass routes can absorb a full closure. By Q1 2026, disruptions had already reduced actual flows by roughly 30% year-over-year to approximately 14.6 mb/d.
How does a Hormuz shipping cost spike feed into consumer prices?
Higher war-risk premiums add directly to freight costs for any operator transiting the strait. Those costs flow through to refiners, fuel distributors, airlines, and manufacturers. Higher fuel and input costs then show up in goods prices and eventually CPI. The mechanism is not instantaneous, but if elevated premiums persist for multiple quarters, the inflationary signal is real and cumulative.