

The Standard & Poor's 500, commonly known as the S&P 500, has been a benchmark for U.S. equity market performance for over two centuries. Over this period, investors and analysts have studied various trends and patterns to understand the nature of market returns and the potential for future growth.
The Standard & Poor's 500, commonly known as the S&P 500, has been a benchmark for U.S. equity market performance for over two centuries. Over this period, investors and analysts have studied various trends and patterns to understand the nature of market returns and the potential for future growth. This article explores the historical performance of the S&P 500, with a focus on long-term investment horizons and the implications for investors.
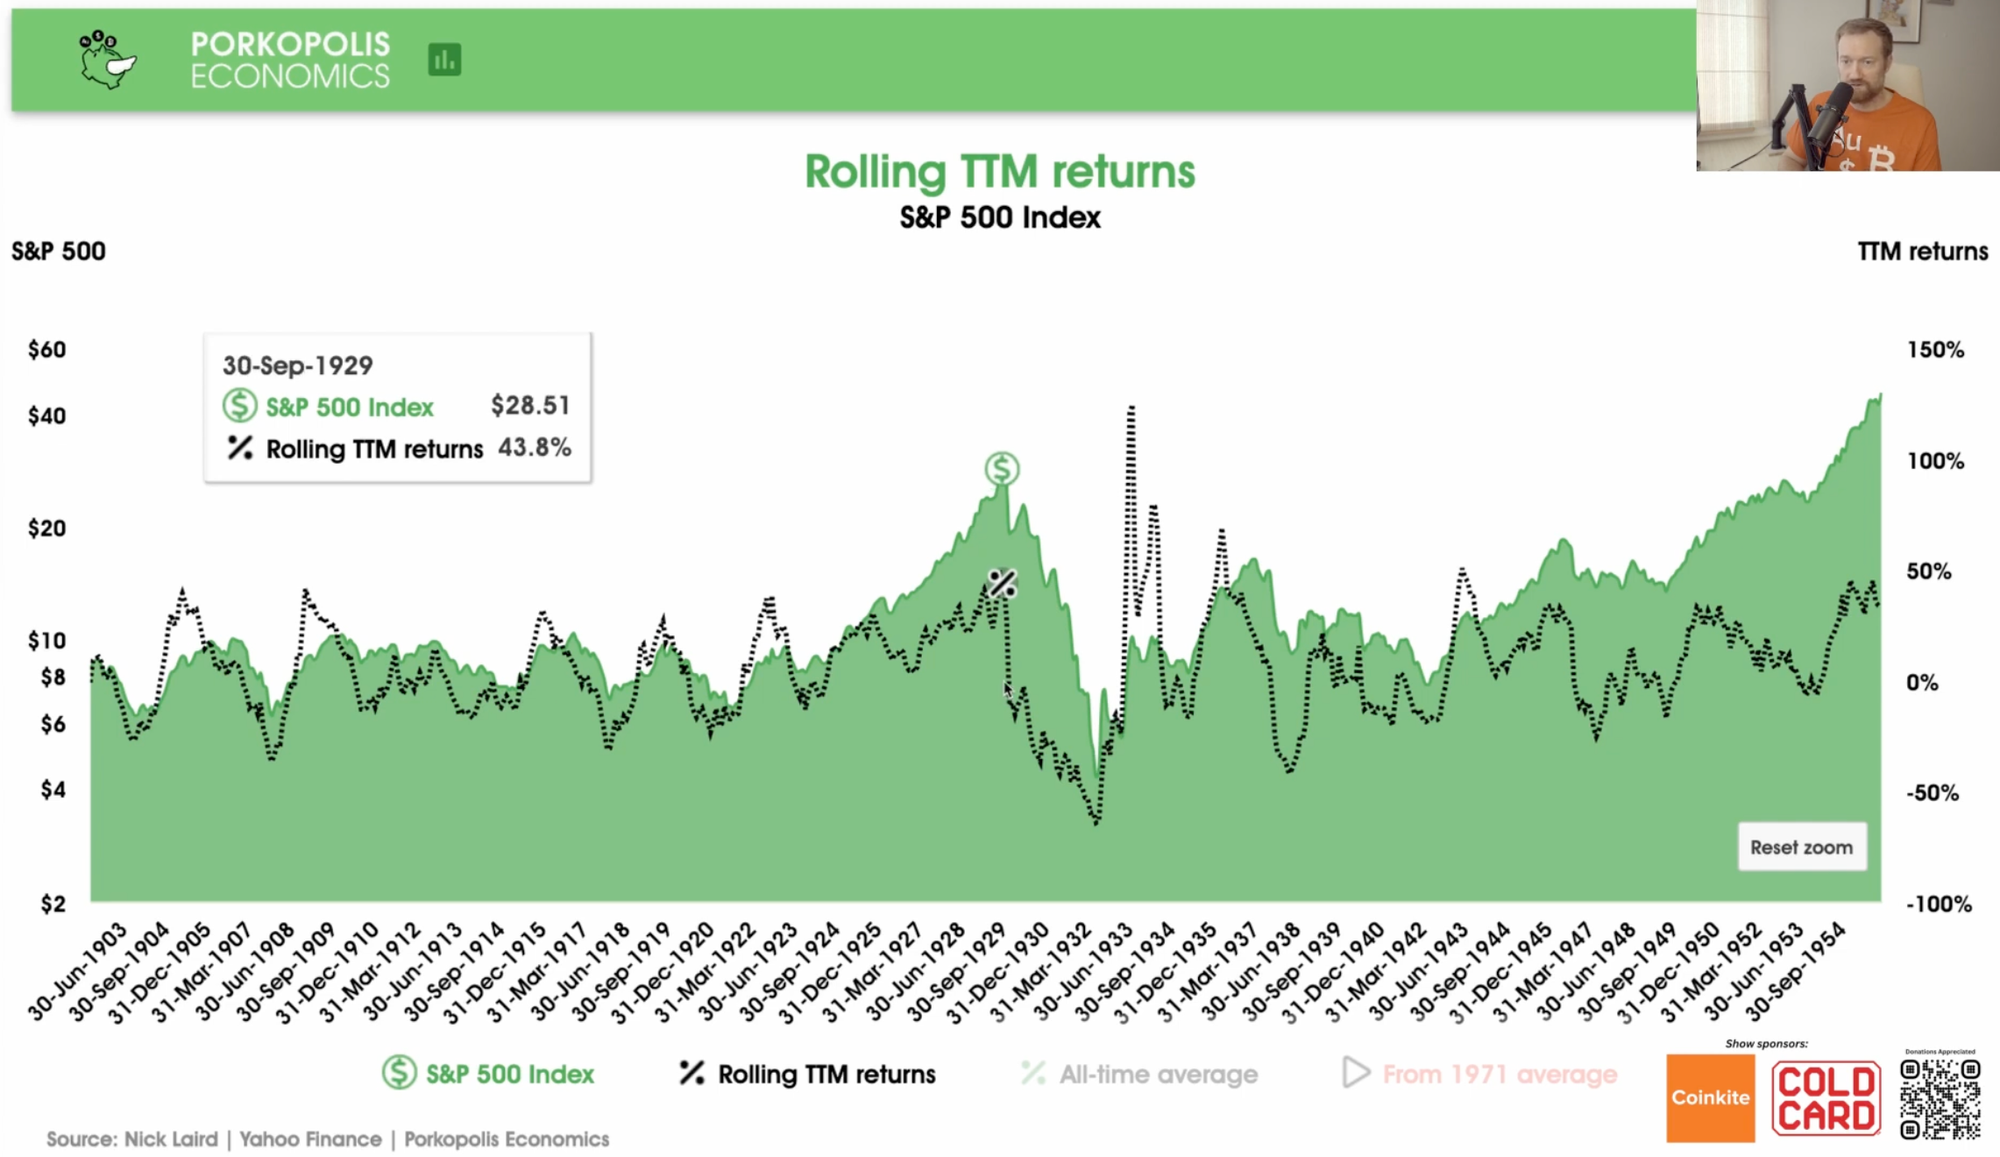
A rolling twelve-month analysis examines the returns of the S&P 500 over successive one-year periods. This method provides a more granular view of market performance compared to an annualized return, which only considers returns from one fixed point in a year to the same point the following year.
The historical data reveals that the S&P 500 exhibits significant volatility when analyzed on a rolling twelve-month basis. The period around major events, such as the onset of World War I and the Great Depression, shows dramatic swings in returns. For instance, in December 1915, the rolling twelve-month return peaked at 31.6%, but by December 1917, it had plummeted to -30%. A similar pattern is observed during the Great Depression, where the return dropped to -64% in 1932 before rebounding to 120% in 1933.
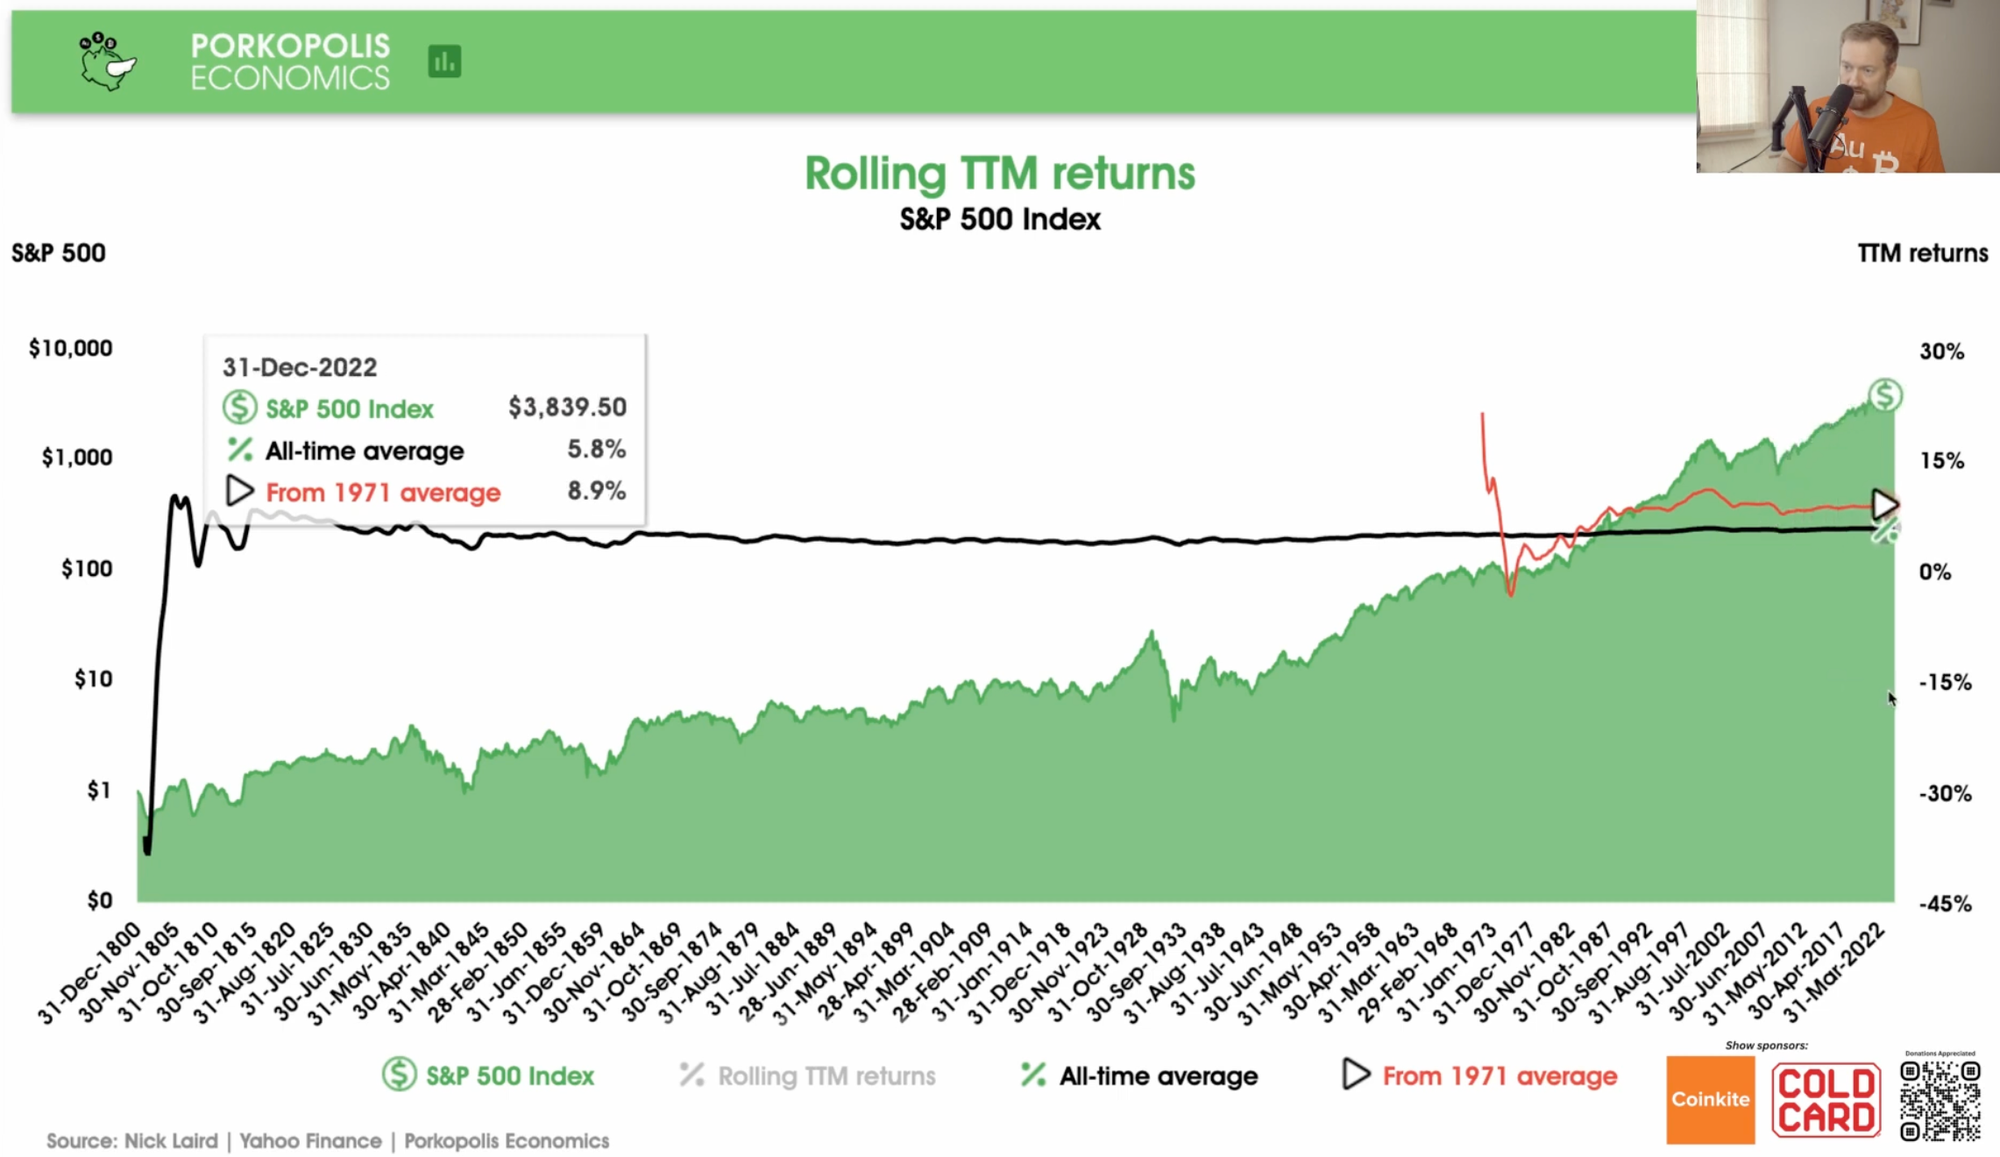
To smooth out the volatility and provide a clearer picture of long-term performance, an average of these rolling twelve-month returns can be calculated. The all-time average return of the S&P 500, when considering the data up to December 2023, stands at approximately 5.8%. This figure provides a benchmark for investors to gauge the expected performance of a diversified stock portfolio over time.
A notable shift in the S&P 500's performance occurred after the United States went off the gold standard in 1971, transitioning to a fully fiat currency system. From this point on, the average S&P 500 return shows an increase. By July 2000, the average trailing twelve-month return had reached 10.9%. Despite downturns during the dot-com bust and the 2008 financial crisis, the average return from August 1971 to December 2023 is 8.9%.
This period's increased returns can be attributed to a combination of monetary policy changes, including the shift to fiat currency, and the acceleration of technological advancements, which have significantly influenced the economy and the stock market.

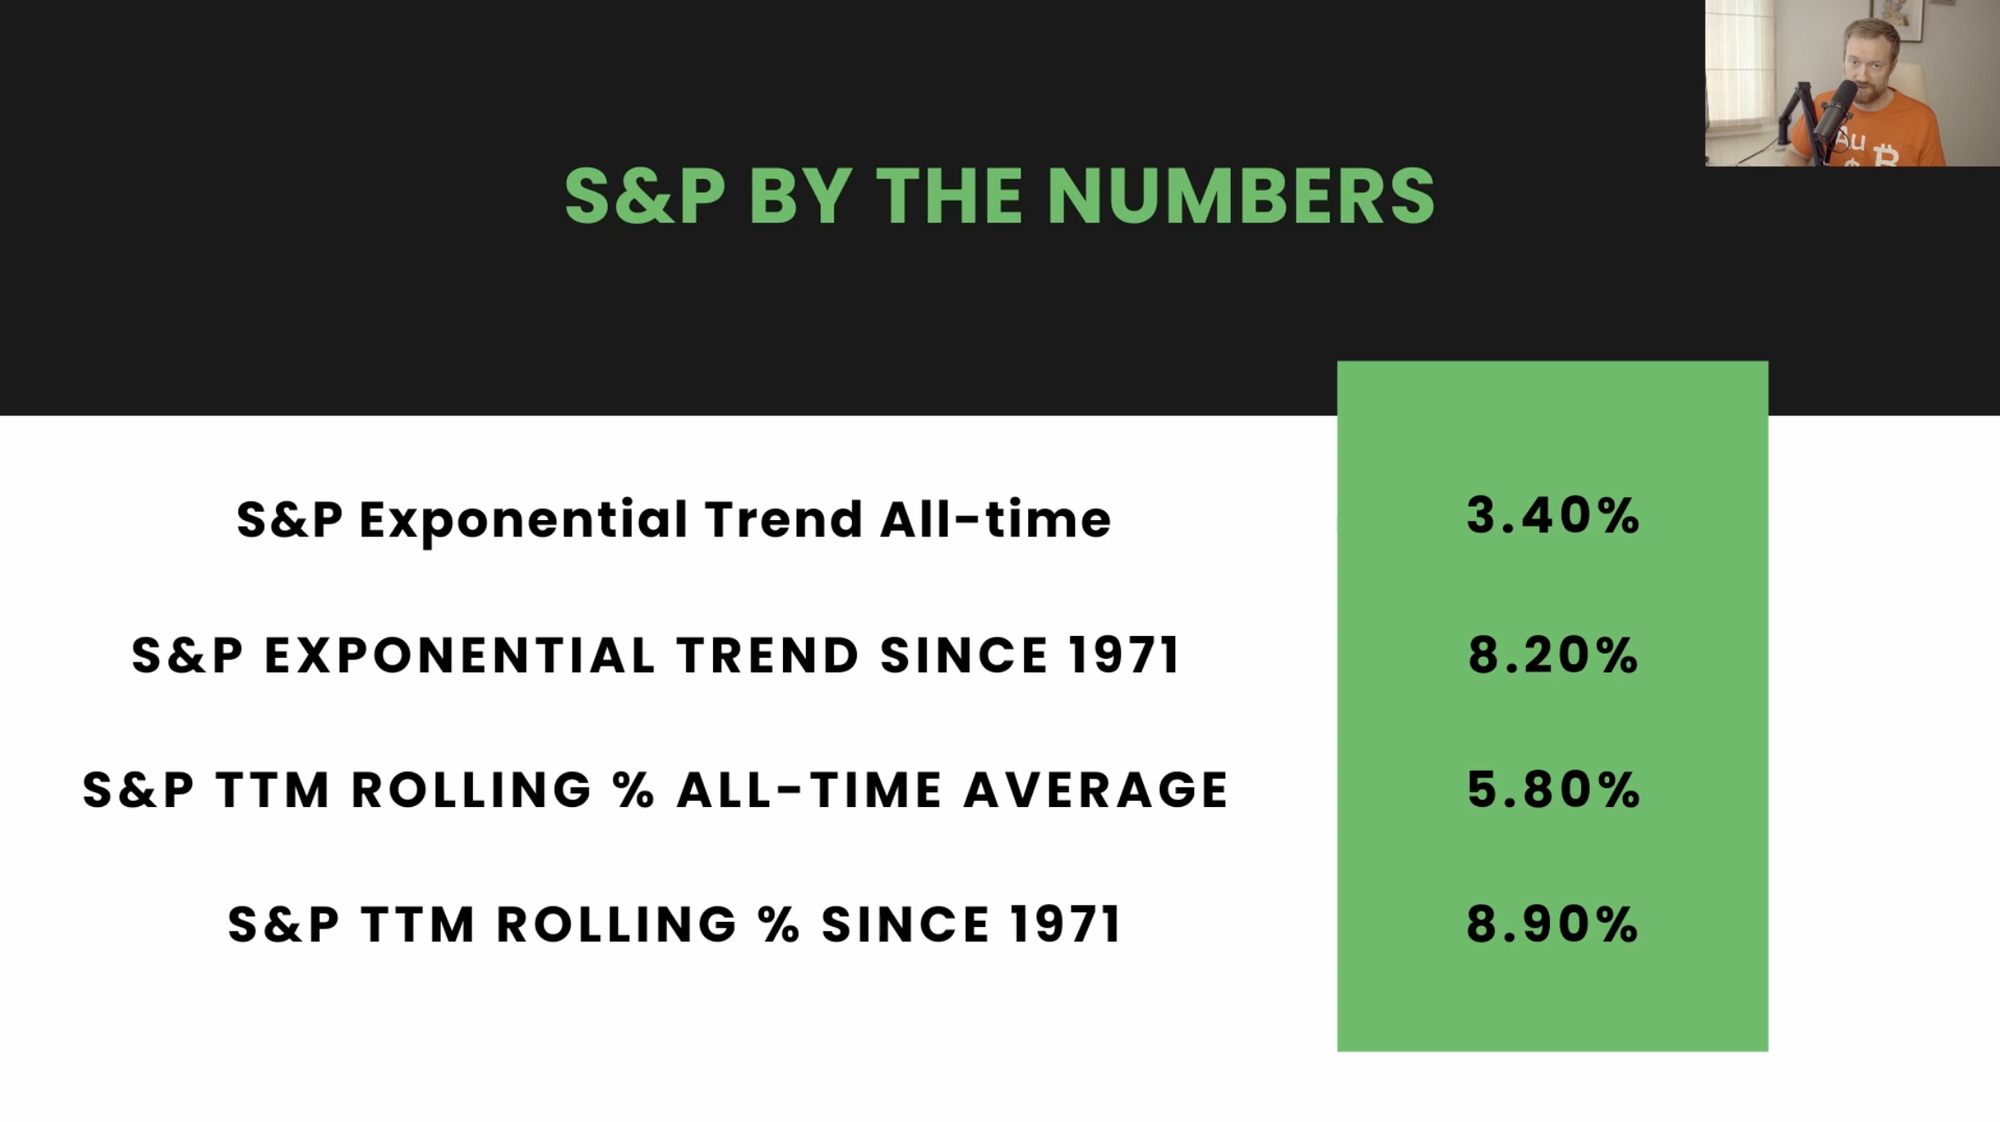
When comparing different methods of analyzing the S&P 500 returns, it is evident that there are discrepancies between exponential trend calculations and average return figures. The all-time exponential trend, which considers the compounding effect over time, yields a lower average annual return of 3.4%, compared to the all-time rolling twelve-month return average of 5.8%.
Post-1971, the divergence continues with the exponential trend showing an 8.2% annual growth rate, while the rolling twelve-month average from the same starting point is slightly higher at 8.9%.
These historical return rates serve as benchmarks for investors seeking to evaluate the performance of their portfolios. While not definitive predictors of future returns, these figures provide a reference to what has been achievable in the past and what investors might aim for in long-term investments.
It is essential to consider the impact of inflation on these returns. The purchasing power of the dollar and its effect on real returns are outside the scope of this historical return analysis. However, investors should aim for returns that at least match these benchmarks to maintain purchasing power over time.
Lastly, it is important to note that these return figures do not account for the reinvestment of dividends. Dividend reinvestment can significantly enhance portfolio growth. It is estimated that reinvesting dividends could add between 1% to 2% to the total return figures discussed above.
The S&P 500 has provided a wealth of data for investors to analyze and understand stock market performance over the long term. The historical analysis of rolling twelve-month returns highlights the inherent volatility in equity markets, while long-term averages offer a more stable perspective on what investors might expect from a diversified stock portfolio. The shift to a fiat currency system and technological progress have influenced the higher returns seen since 1971. For investors, these historical trends are a guide for benchmarking portfolio performance and setting realistic expectations for future growth.